Readability refers to the ease in which a text can be read. In order to accurately determine a text’s readability, many factors need to be considered and calculated. Precise computer algorithms are formulated to analyze multiple components of a text including word count, sentence length, characters per word, etc. Several of the most widely used readability scoring methods are listed and explained below. Each scoring method analyzes different factors, meaning results are also varied. When analyzing text readability, a combination of scoring methods will provide the most consistent and reliable results. Links to free text analyzers are included at the bottom of the post.
Flesch Reading Ease and Flesch-Kincaid Grade Level
History
The Flesch Reading Ease test was developed in the 1940s by Rudolph Flesch, a consultant for the Associated Press, to improve the readability of newspapers. Flesch’s innovative new test produced a score that aligned the text with a corresponding grade level. Thirty years later, Peter Kincaid and a team of Navy researchers improved upon Flesch’s formula, making the test easier to use.
Key Points
- The Flesch-Kincaid Grade Level score aligns the text with a US grade level. For example, a score of 8.4 indicates that the text will be understood by an average student in 8th grade.
- Flesch-Kincaid readability scores are useful any time you want to quickly measure how easily students will understand a piece of text.
- Flesch-Kincaid is one of the most widely recognized readability scoring formulas, making it an extremely reliable measure of text readability.
Factors
- Average Sentence Length
- Average Word Length
Dale-Chall Score
History
The Dale-Chall vocabulary-based scoring method was created by researchers Edgar Dale and Jeanne Chall in a 1948 article titled “A Formula for Predicting Readability”. The formula scores readability using a list of 3,000 words familiar to most fourth grade students.
Key Points
- The Dale-Chall formula is best suited for grades four through ten.
- Text readability is computed based on the number of words in the passage that are not on the list of 3,000 familiar words.
- The greater the number of unfamiliar words in a piece of text, the higher the score (scores are equivalent to grade levels). For example, a score of 4.9 or lower means the passage is comprehensible for the average 4th grade student.
Factors
- Percentage of Difficult Words
- Average Sentence Length
Lexile Framework
History
The Lexile Framework was developed in the 1980s by educational researchers A. Jackson Stenner, Ph.D and Malbert Smith, Ph.D. who wanted a better measurement system for reading and writing.
Key Points
- The Lexile Framework is a system for matching readers and text. Lexile measures are represented by a number followed by an “L” (such as “800L”) and range from below 0L for beginning readers and texts to above 1600L for advanced readers and texts.
- Generally, longer sentences and words of lower frequency lead to higher Lexile measures, while shorter sentences and words of higher frequency lead to lower Lexile measures.
- Scholastic’s Reading Counts program uses the Lexile Reading Framework to match readers with appropriate text levels.
- Lexile ranges vary for each grade level. Click here to see the Lexile ranges for each grade.
Factors
- Word Frequency
- Average Sentence Length

Powers-Sumner-Kearl Readability Formula
History
The Powers-Sumner-Kearl Readability Formula was created by researchers R.D. Powers, W.A. Sumner, and B.E. Kearl in an effort to modernize the existing readability formulas. It was first published in 1958 in the Journal of Educational Psychology.
Key Points
- The Powers-Sumner-Kearl formula is most appropriate for text directed at children between the ages of seven and ten, or between second and fourth grade.
- The Powers-Sumner-Kearl formula is not considered useful for children’s literature above a reading age of 10.
Factors
- Number of Words
- Average Sentence Length
- Number of Syllables
The Fry Graph
History
The Fry Graph Readability Formula was developed by Fulbright Scholar Edward Fry in the 1960s. It is often selected as a scoring method for its simplicity and accuracy.
Key Points
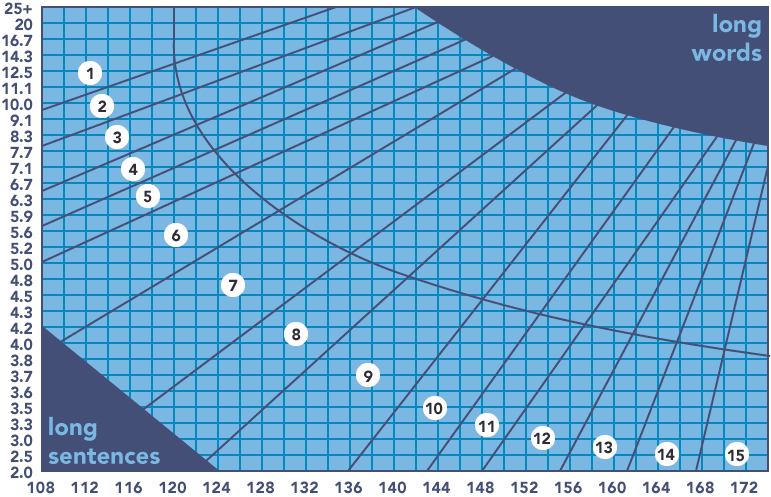
- The Fry Readability Formula assigns a grade level to a passage of text. The grade level is determined by plotting the average number of syllables and sentences on the Fry Readability Graph.
- The Fry Readability Graph has two axes: the average number of syllables (x-axis) and the average number of sentences (y-axis) per 100 words. Passages of text that are at least 100 words can be plotted on the graph to determine the corresponding grade level.
Factors
- Average Number of Sentences (per 100 words)
- Average Number of Syllables (per 100 words)
Free Text Readability Analyzers
Click on the links below to access the free text readability analyzers.
readable.com
datayze.com
lexile.com
readabilityformulas.com
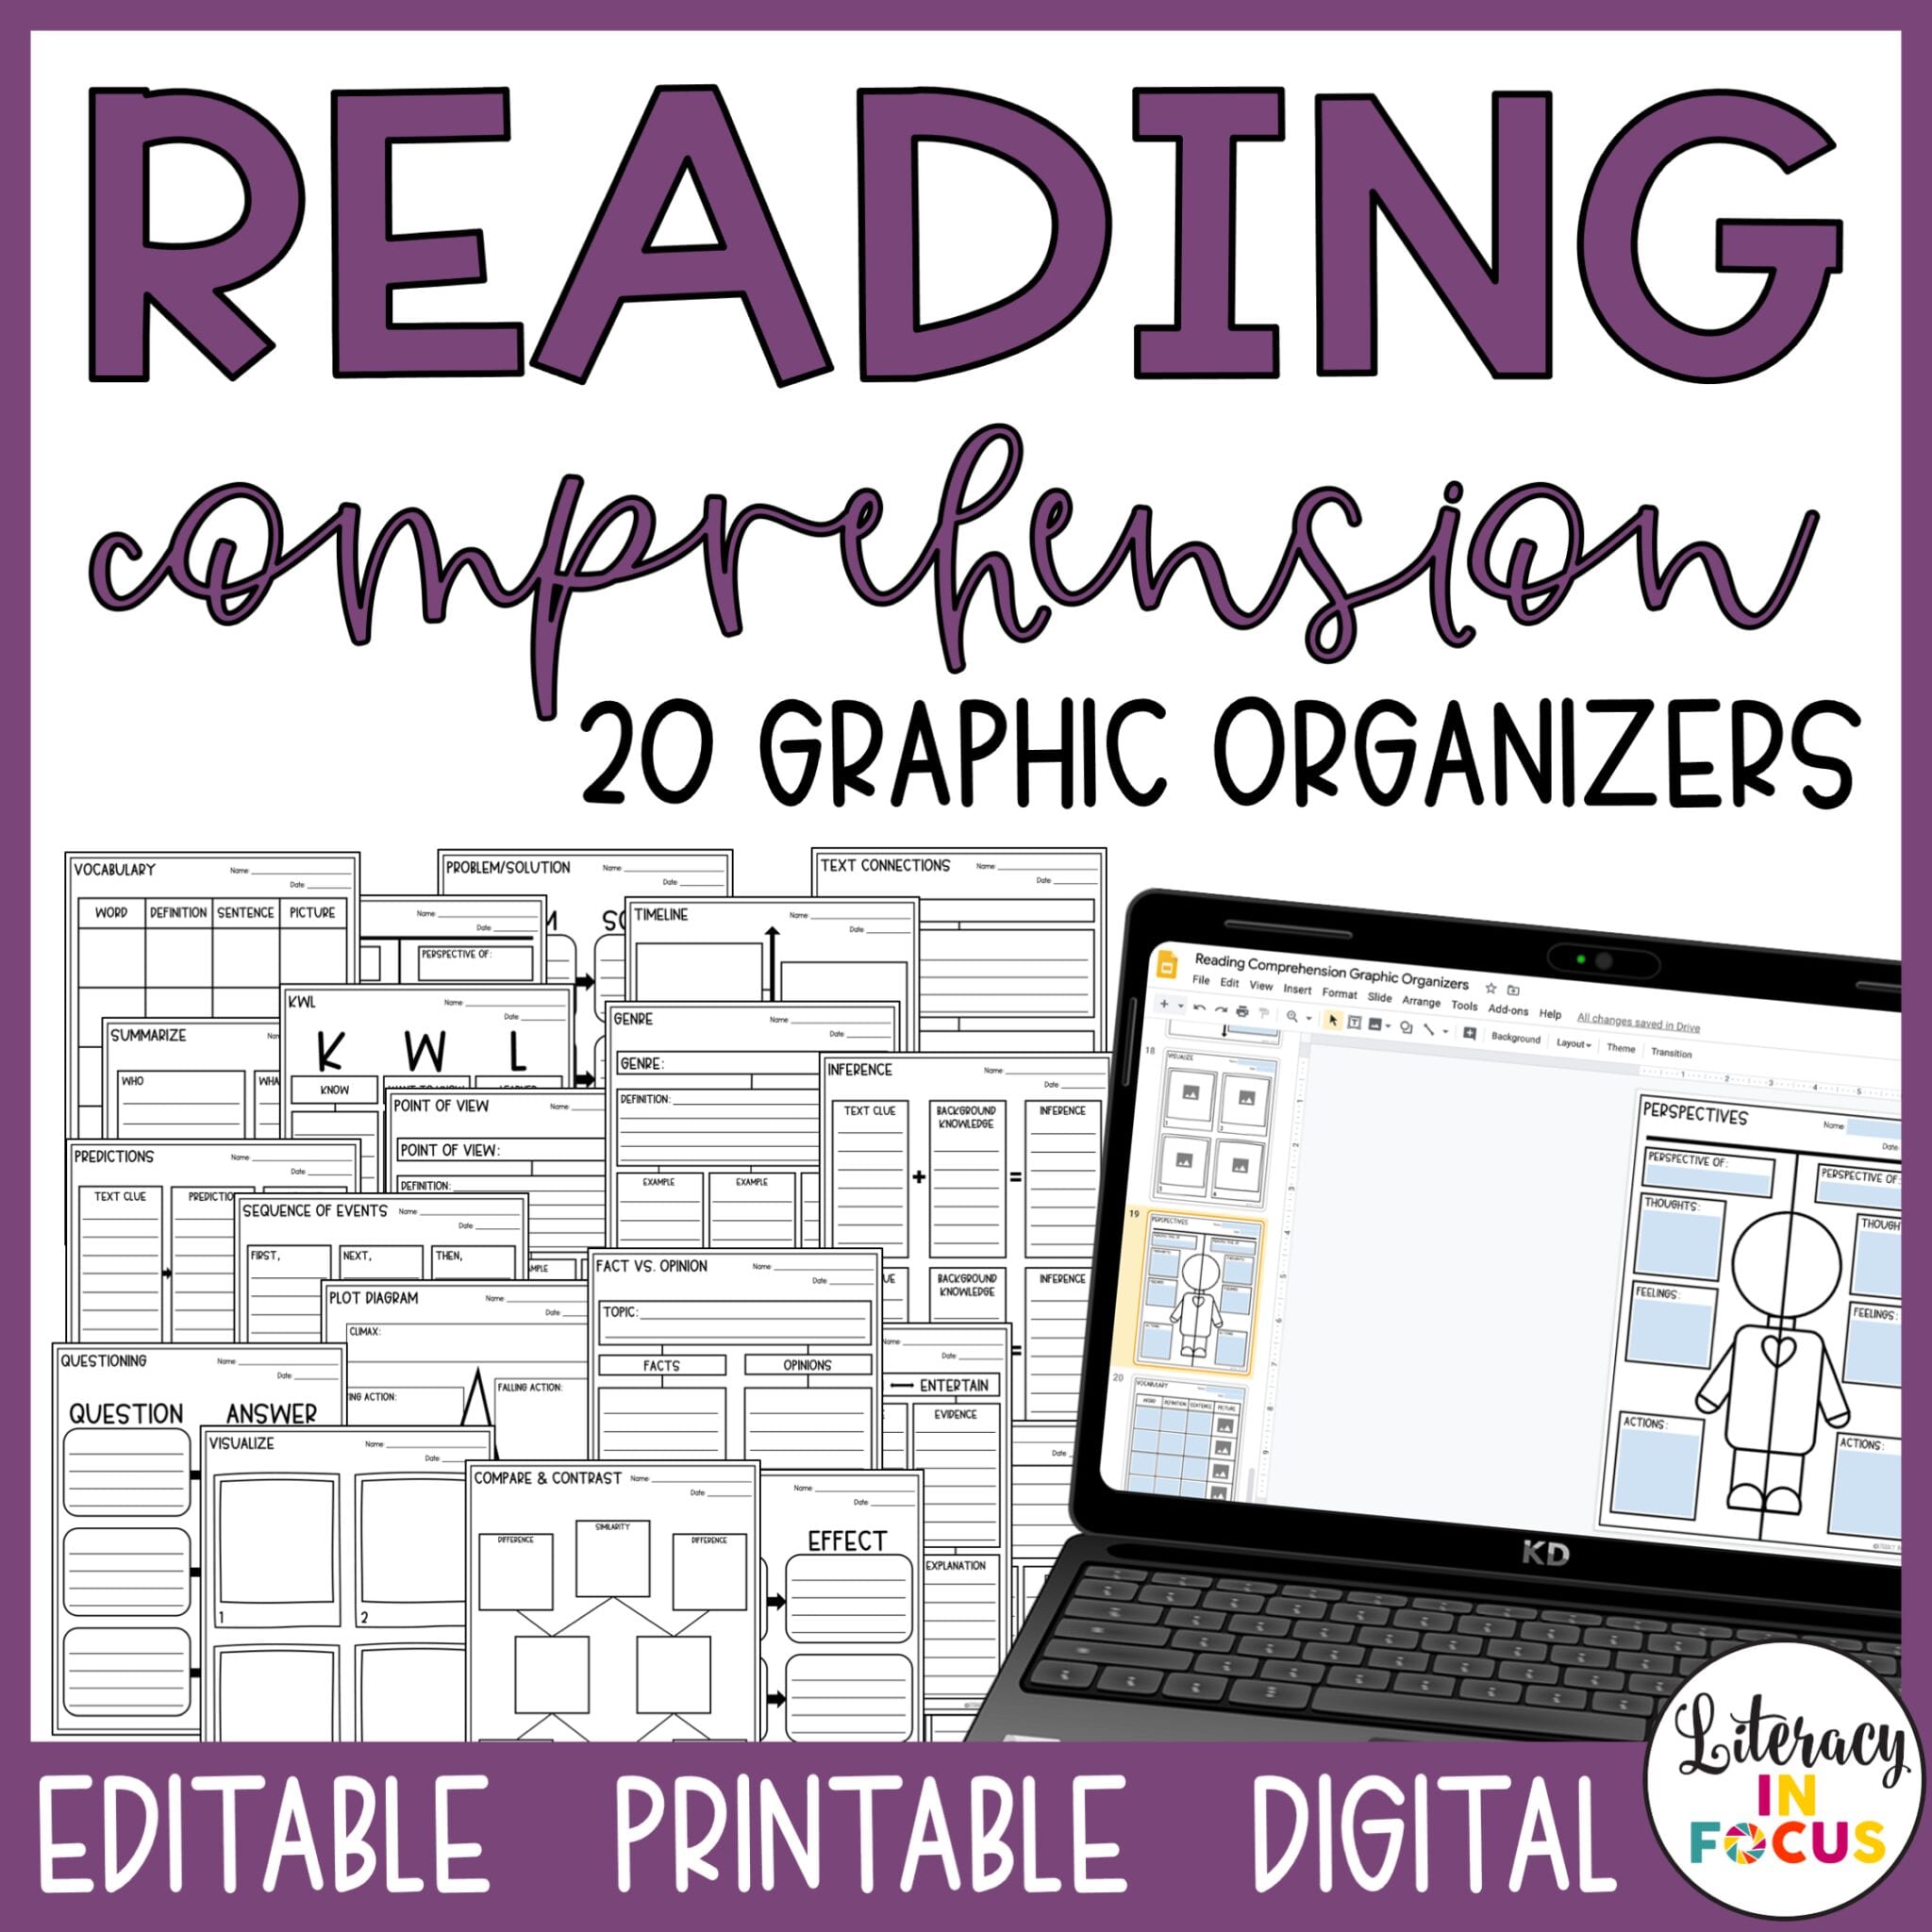
Support reading comprehension with graphic organizers! Download 20 printable, editable, and digital graphic organizers for use with fiction and nonfiction text.
I have found that students can visualize things much better when they are able to use graphic organizers. This is a great resource for that. Thank you for creating this! -Misty P.

By Brooke Khan, M.Ed
Updated June 11, 2024